Targeted Improvement of Plant Performance with STREMLER Dashboards
Where should you start to improve a plant’s performance? We often encounter this question in conversations with our customers. Sometimes the issue is recurring machine downtime, other times it’s material availability, or making better use of existing capacity. For executive and plant management, it’s crucial to work together to identify which measures can have the greatest impact.
STREMLER Dashboards integrate key performance indicators with data from production and materials management. This allows decision-makers to see at a glance where performance deviates from the plan. On this shared foundation, they can prioritize actions and verify whether they are achieving the desired results.
We create a reliable database and implement the dashboards so that decision-makers can use them in their daily planning and management. Together, we get to the root causes of deviations, derive concrete measures, and support their implementation in day-to-day operations.
Four Pillars for Improved Performance in Production and the Supply Chain
Some of our clients want to increase the availability of their machines or stabilize their material supply. Others want to reliably commit to delivery dates, better plan staff deployment, or secure their margins amid fluctuating raw material prices.
We focus on the areas where our clients have the greatest need for action. To achieve this, we combine four areas of expertise, depending on the task at hand.
Process Optimization with STREMLER Supply Chain Engineering
We align the value chain with customer needs—from order processing through production to collaboration with suppliers. This improves delivery capability and capacity utilization while strategically reducing inventory.
Data Analysis and Data Optimization
We identify relevant data, verify its quality and availability, and develop appropriate data models and key performance indicators. This enables companies to identify where bottlenecks arise and where processes can be improved. To this end, we also undertake independent data projects.
Shop Floor Optimization with OPX
Together with on-site teams, we improve workflows and material flows, shorten setup times, and reduce downtime. Key performance indicators help prioritize measures and verify whether the improvements are sustainable in day-to-day operations.
Planning and Control with STREMLER Realtime Technologies
Our modular planning technologies build on existing ERP systems and coordinate production, logistics, and procurement. Using a Digital Twin and What-if Scenarios, companies can compare different courses of action and evaluate their impact on the entire supply chain.
The following four dashboard sections show how companies can use this data to inform their decisions—from management metrics and site performance to OEE and material supply.
Site Performance Management Dashboard
Where is a plant losing performance, and which corrective actions take priority? Site management consolidates reports from many departments. The Site Performance Management Dashboard combines departmental metrics, key areas of loss, and corrective actions in a single view.
What the Dashboard Shows
The overview aggregates metrics from production, quality, engineering, purchasing, and materials management. A Pareto chart ranks loss contributors by magnitude. For the selected focus area, the root cause analysis shows which factors account for the largest share of the loss. The action overview indicates who is responsible for which task, by when, and the current status of implementation.
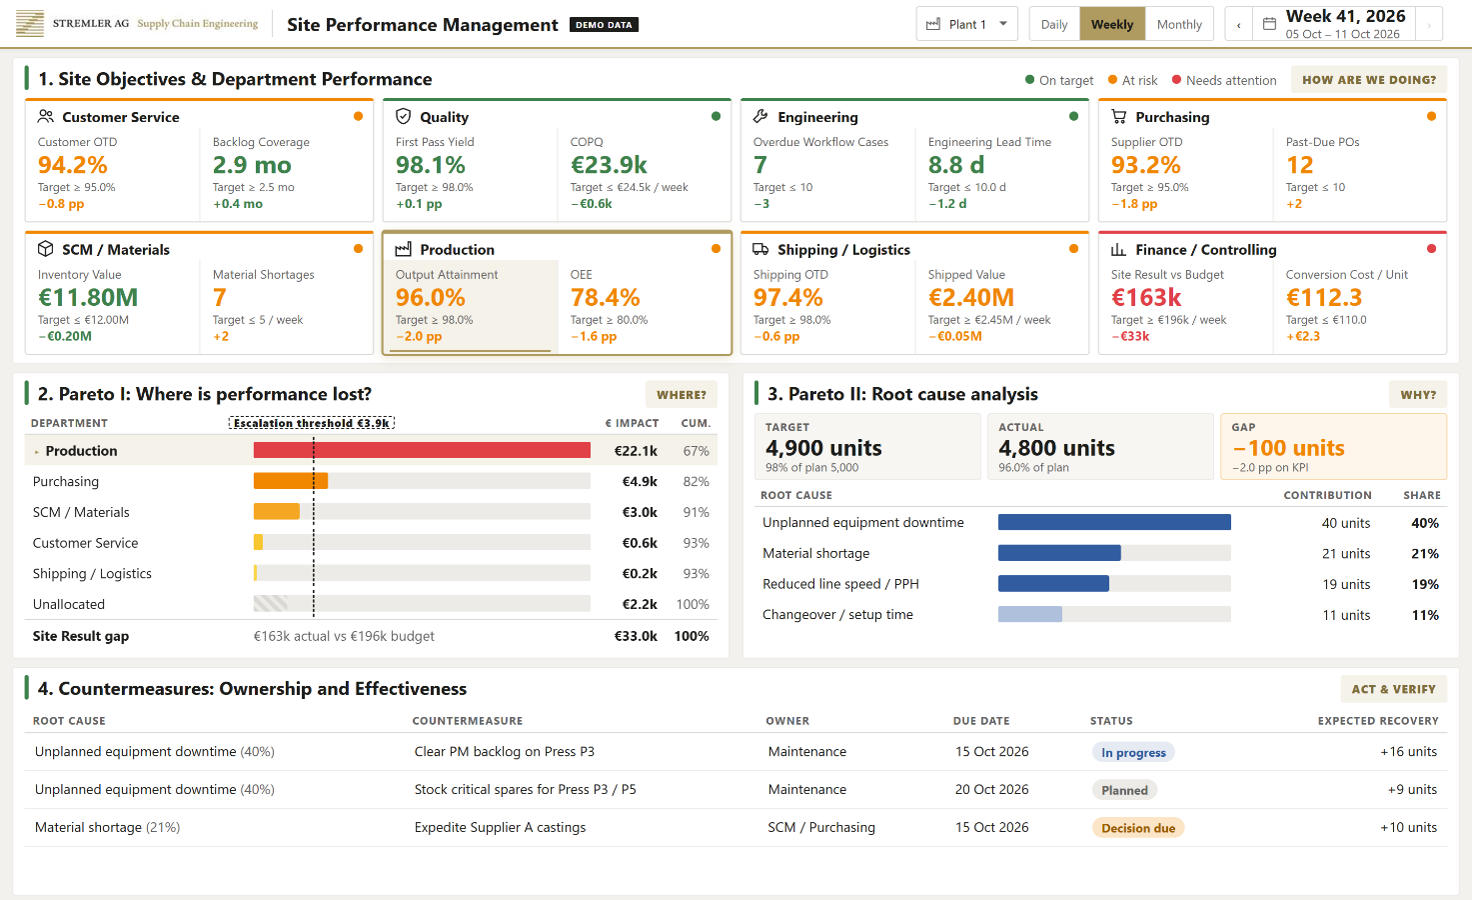
Site Performance Management Dashboard – Departmental Key Metrics, Key Loss Areas, Causes, and Actions. Values shown are synthetic demonstration data.
What the Example Shows
In the example, production accounts for the largest loss contribution. The root cause analysis shows that unplanned downtime plays a significant role in this. In the action overview, plant management can see which tasks are already underway, who is responsible for them, and by when they are scheduled to be implemented.
What decision follows
Plant management, production, and maintenance coordinate to determine which measures take priority and what resources are needed to implement them. The key factor is the expected contribution to the performance of the entire site. Based on this, senior management can decide where to allocate budget, personnel, and maintenance capacity first.
How the impact is monitored
In regular coordination meetings, the parties involved compare the status of the measures with the trends in key performance indicators. In the example, once a measure is completed, this allows them to verify whether unplanned downtime is actually decreasing and whether the targeted improvement has been achieved.
“Good performance management reveals which factors have the greatest impact on a site’s performance. We measure progress against clear goals, identify deviations early on, and can respond in a targeted manner. When we understand the root causes, we can allocate our resources where they will have the greatest impact. By regularly reviewing the impact of our measures, we improve site performance step by step.”
Hans Huber, CEO of STREMLER AG
Management KPI Dashboard
Where should we take action first? When production, quality, delivery, and costs are reported separately, it’s often difficult to get a holistic view of priorities. The Management KPI Dashboard consolidates key operational metrics and highlights deviations and trends.
What the Dashboard Shows
The overview includes selected key performance indicators such as OEE, production target achievement, on-time delivery, scrap, outstanding material bottlenecks, maintenance backlog, and realized savings. Target values and variances indicate where risks arise. The status history spanning twelve periods helps distinguish individual outliers from sustained trends.
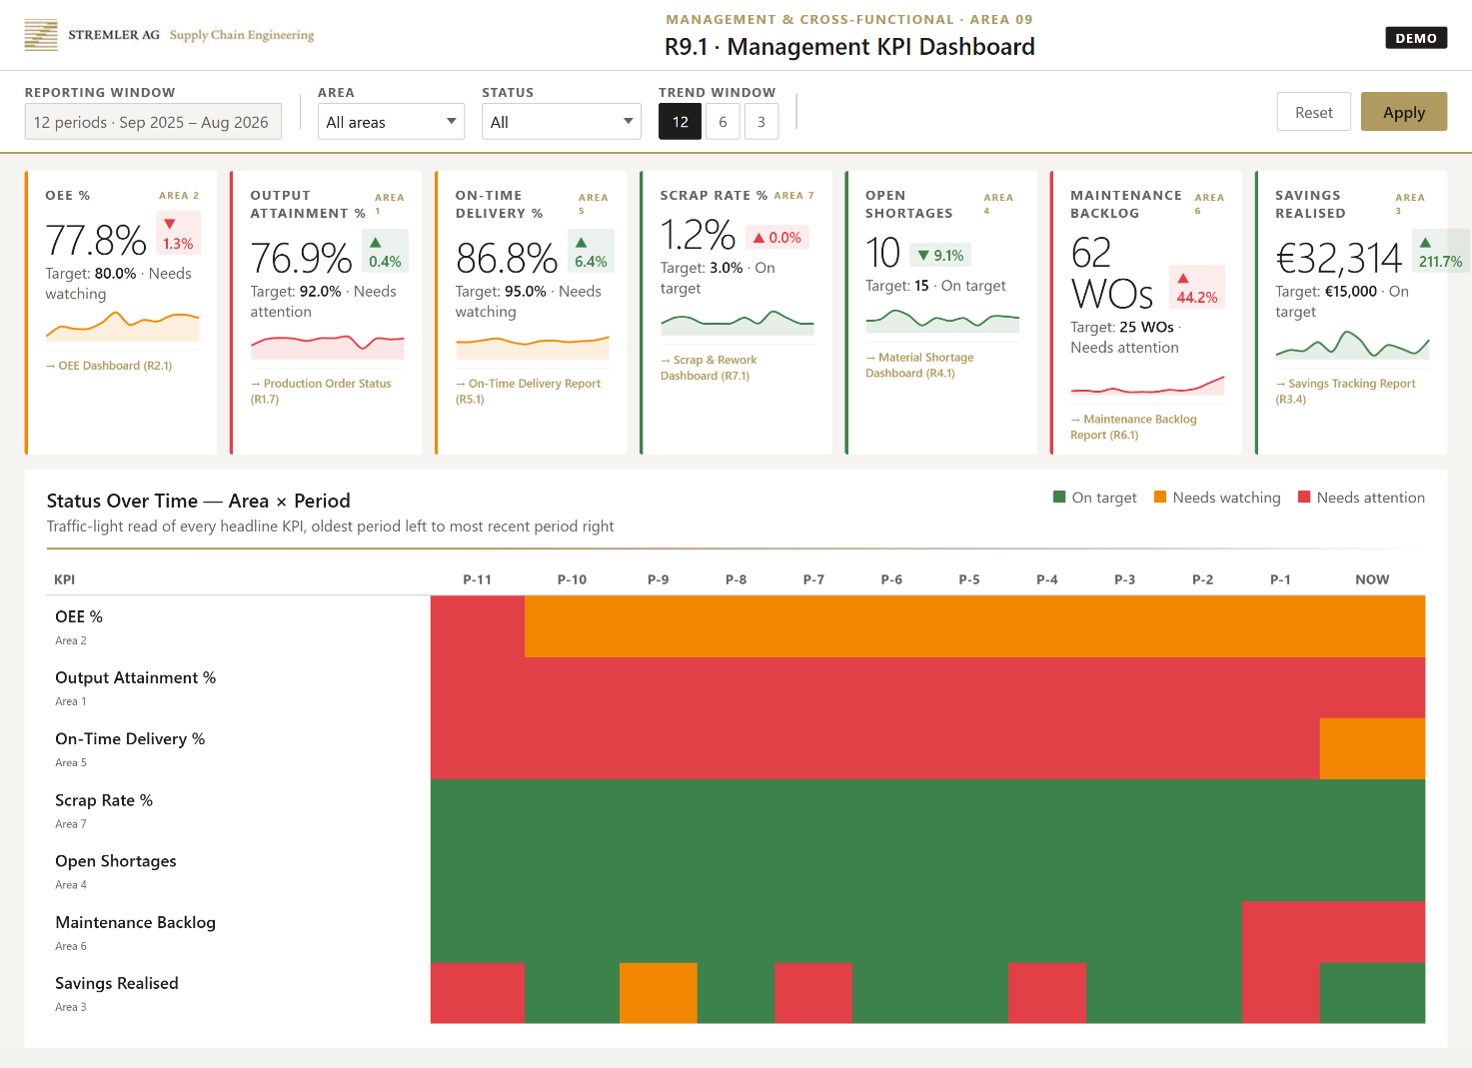
Management KPI Dashboard – Target values, variances, trends, and status history over twelve periods. Values shown are synthetic demonstration data.
What the Example Shows
In the demonstration example, the maintenance backlog increases over several periods. This raises a specific question: Which pending tasks involve equipment whose failure would jeopardize production or delivery capability? The overview provides a reason to examine these relationships in detail together with Production and Maintenance.
What decision follows
The size of the backlog alone does not determine the order of priority—the operational impact is the decisive factor. Production and maintenance therefore assess which maintenance tasks take priority and how the necessary downtime windows can be coordinated with production planning.
For management, a creeping risk thus becomes apparent early on. They can allocate maintenance budgets and personnel in a targeted manner as long as downtime can still be planned. This ensures delivery dates and avoids unplanned costs.
How the Effect Is Assessed
In the following periods, the dashboard shows whether the backlog is decreasing and how OEE, production target achievement, and on-time delivery are trending. This makes it clear whether the agreed-upon measures are having an effect or whether further decisions are needed.
OEE Dashboard
Where is production output being lost—and which cause should we address first? Low Overall Equipment Effectiveness (OEE) can be due to downtime, insufficient speed, or quality losses. Different measures are appropriate depending on the cause.
What the Dashboard Shows
OEE combines availability, performance, and quality into a single metric. The STREMLER OEE Dashboard integrates target comparisons with the analysis of production lines, time trends, and causes of losses. The performance overview and the detailed view of downtime complement each other.
The OEE Performance Analysis compares production lines and machines and shows their performance over time. It helps narrow down the need for action to specific equipment or lines and identify recurring losses.
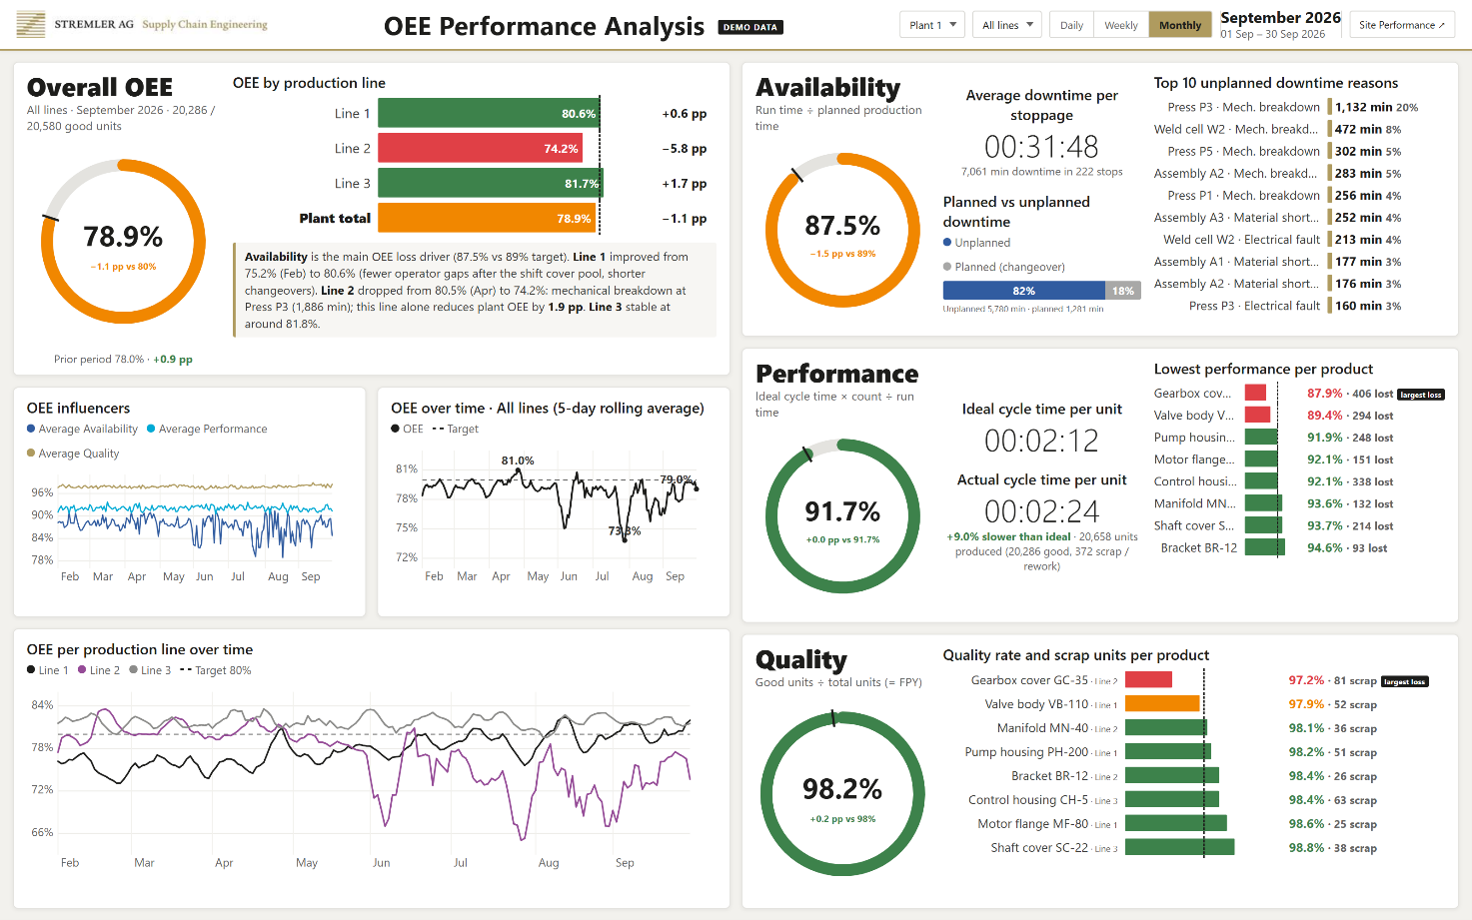
OEE Performance Analysis – Line comparison, trends over time, and analysis of OEE dimensions. The values shown are synthetic demonstration data.
The OEE Loss Detail view breaks down the causes of losses further. For example, a Pareto analysis shows the proportion of lost production time attributable to mechanical failures, material bottlenecks, or cleaning times.
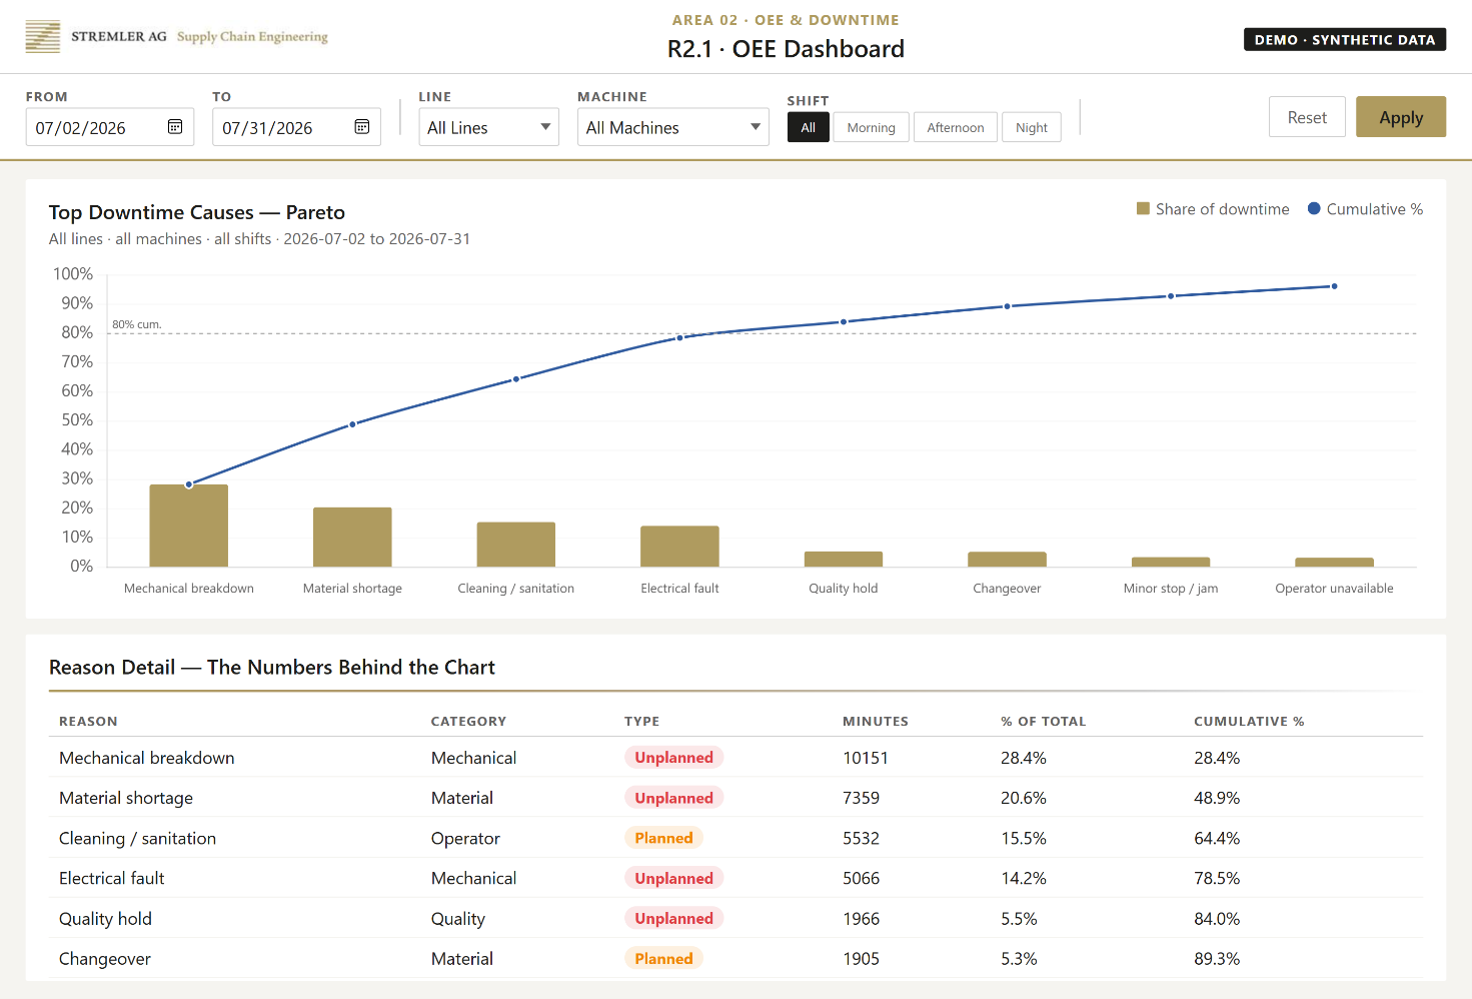
OEE Loss Detail – Causes of downtime and their contribution to lost production time. The values shown are synthetic demonstration data.
What the example shows
In the performance overview, the OEE of 78.9% is below the target of 80%. Availability, performance, and quality highlight the various areas of loss. A supplementary demonstration example in the downtime analysis shows mechanical failures as the leading cause of lost production time, followed by material bottlenecks. Each view displays the selected time period, thereby helping to pinpoint specific areas requiring action.
What decision follows from this
Production management and maintenance examine the affected equipment and failure patterns and define measures to address the primary causes of disruptions. In the case of material shortages, purchasing and planning are also involved. Prioritization takes into account not only the lost time but also the impact on orders and bottlenecks in the production flow.
For management, the OEE analysis provides a solid foundation for investment decisions: Before planning additional equipment, shifts, or outsourcing, it becomes clear how much capacity can be freed up in the existing lines. Every percentage point of OEE on a bottleneck line means additional output from existing capital.
This is where shop floor optimization comes in: STREMLER works with the teams to develop concrete improvements and supports their implementation in the operation. An identified cause of loss is turned into a work order with assigned responsibility, a deadline, and a target.
“In the OEE dashboard, I first see which line or shift stands out. If there are frequent short stoppages there, we go directly to the equipment with the team and check, for example, whether they occur during a specific product changeover. Once we modify the process, we monitor the following shifts to see if the stoppages become less frequent and output increases.”
Dr. Bernhard Gottwald, Senior Project Manager, STREMLER AG
How the Impact Is Monitored
The same analyses then show whether downtime is decreasing, availability is increasing, and OEE is improving sustainably. Tracking changes over time helps assess whether a measure has a lasting effect or if losses are recurring.
Material Shortage Dashboard
Which missing parts are jeopardizing our orders—and what can still be addressed in time? Even a high-performance system can only produce if the material is available. For purchasing, planning, and plant management, the connection between the missing part, the required delivery date, and the affected order is therefore crucial.
What the Dashboard Shows
The Material Shortage Dashboard compares available inventory with demand. It displays shortages, affected production orders and lines, as well as expected delivery dates. Filters for critical items facilitate daily coordination. The general notification “Material missing” is transformed into a concrete to-do list.
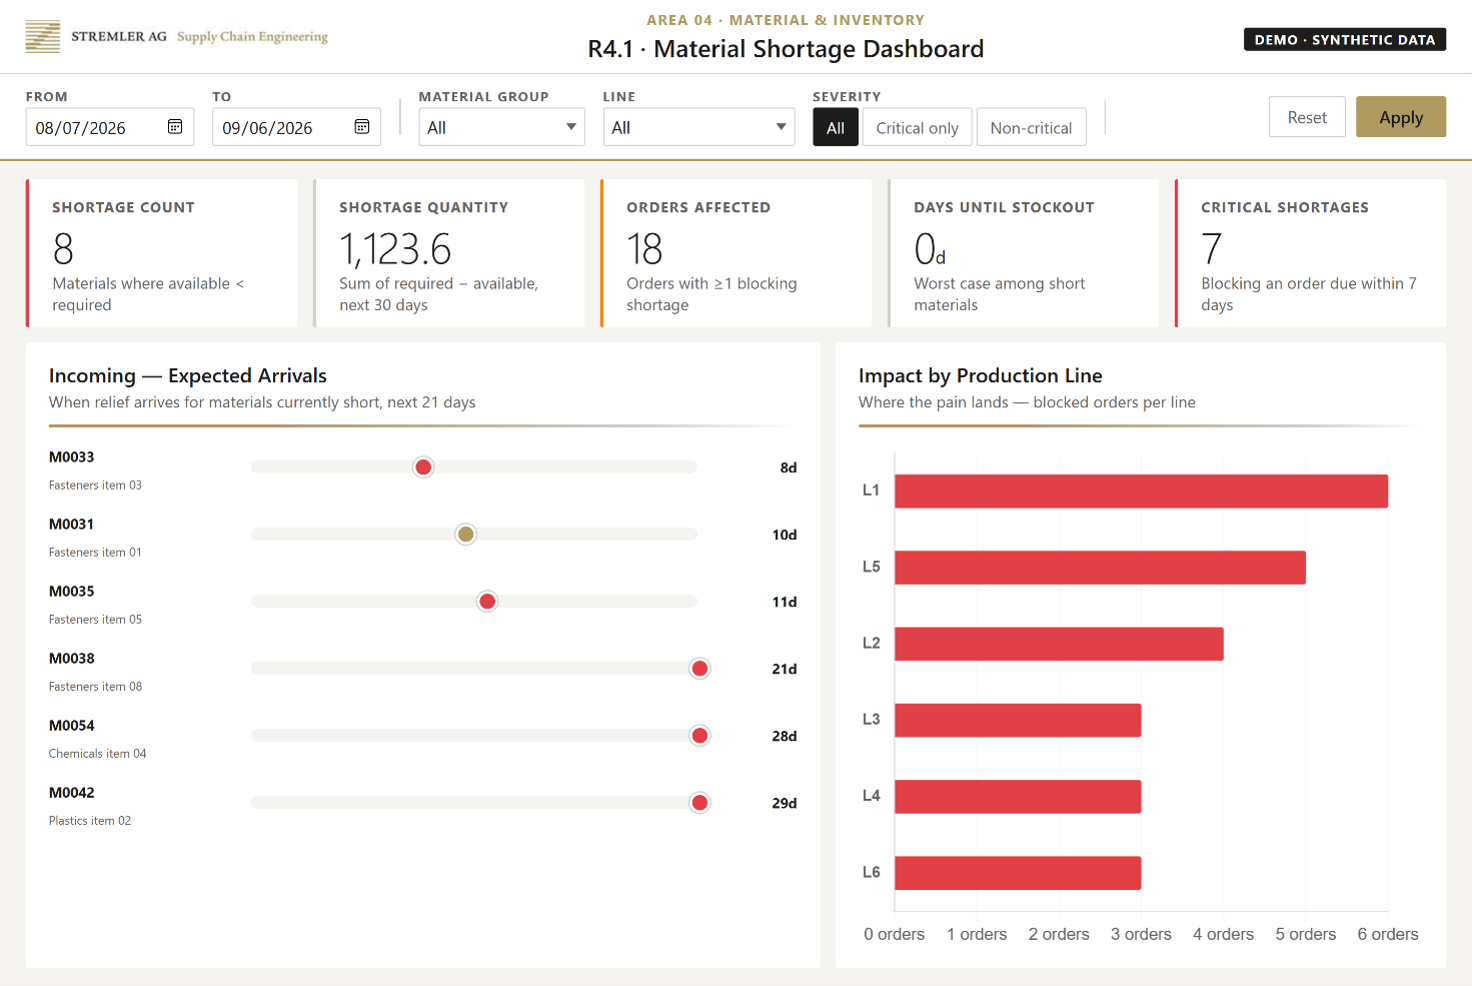
Material Shortage Dashboard – Missing parts, expected goods receipts, and affected production orders and lines. The values shown are synthetic demonstration data.
What the Example Shows
In the demonstration example, eight material shortages affect a total of 18 production orders. Seven items are marked as critical because they are blocking orders due within seven days. The overview also shows expected goods receipts. Purchasing and planning can verify whether these will arrive on time and where a supply gap will remain until then.
What decision follows
Purchasing coordinates with suppliers to determine which material deliveries can be expedited and what express shipping would cost. Production planning assesses which orders can be moved up or postponed and whether a special shift could help. If confirmed delivery dates change, Sales coordinates the next steps with the affected customers.
Based on this, those in charge decide which measures take priority. Management identifies early on which customer orders and revenue are affected. In the event of significant additional costs or competing delivery commitments, management can decide which measures make economic sense.
How the Effect Is Assessed
At the next coordination meeting, the updated list of missing parts shows which parts are still missing and which customer orders remain at risk. A comparison with the production plan and the confirmed delivery dates reveals whether the measures are having the desired effect.
If it becomes apparent that similar bottlenecks are recurring, STREMLER can work with the company to investigate where they originate in procurement or planning and which processes can be improved on a long-term basis.
From a Shared Database to Implementation
The four dashboard sections complement one another in day-to-day operations. Management tracks target achievement and the development of key performance indicators. The site overview shows where improvements are a priority and consolidates ongoing measures. The OEE analysis reveals how individual machines are performing and the causes behind any deviations. In the event of material bottlenecks, the material overview shows which parts are missing and which orders and delivery dates are affected.
Integrating Dashboards into Daily Operations
Companies can start with a dashboard designed to address a specific issue. If the relevant data is already available, the dashboard can be set up quickly. If data is missing, we help collect it and build a reliable database. Together with the responsible parties, we define the appropriate key performance indicators and integrate the dashboard into daily planning and coordination.
Deriving Improvements from Findings
If, for example, material shortages occur repeatedly during operations, we work with the responsible parties to analyze the causes and develop corresponding measures. For each measure, we agree on who will implement it, by when it should be implemented, and how we will measure its effectiveness. Depending on your needs, our support ranges from targeted process improvements to the implementation of integrated real-time planning and control using STREMLER Realtime Technologies.
A suitable starting point for your specific situation
A joint project can begin with a specific question: What data is missing for reliable decision-making? Where do recurring performance losses occur? Which material shortages jeopardize delivery capability? From there, we determine the appropriate scope—ranging from data preparation and a single dashboard to further process optimization and planning.
The dashboards are available for Power BI and can integrate data from ERP and shop floor systems. This requires jointly defined metrics, appropriate target values, and a reliable data connection. The timeliness of the data depends on the respective connections and update intervals. Prepared data and models can also be used for existing or other systems.
Measurable Results from Real-World Experience
In completed projects, we have worked with our customers to increase performance by 15–20% and reduce lead times by more than 50%. These results stem from the synergy of process optimization, data, shop floor optimization, and STREMLER Realtime Technologies. The dashboards support the analysis, prioritization, and review of measures.
The improvements can typically be implemented within 8–10 months. The investment pays for itself on average 4–6 months after implementation. The potential achievable depends on the initial situation and the agreed-upon scope of the project.
Where is your greatest leverage?
Would you like to know where your production can be specifically improved or which orders are affected by material bottlenecks? In an initial consultation, we’ll clarify your specific questions, assess your existing data, and determine a sensible starting point. This will highlight where an in-depth analysis can begin and which next steps are right for your company.
Which dashboard will provide the greatest benefit to your company?
In an initial strategic assessment, we’ll work with you to determine which decision currently offers the greatest leverage for your company and what data is already available for that purpose. Based on this, we’ll recommend the best dashboard to start with and how you can measure its effectiveness.